
Learn how to extract all p-values from a multiple response linear regression model in R when you’re performing multiple linear regression in R using the lm() function.
Extracting p-values can help assess the significance of your model’s coefficients, making it a key step in statistical analysis.
In this guide, we’ll walk through how to extract all p-values from a multiple response linear regression model (lm) in R.
Understanding lm() and P-values in R
The lm() function in R fits a linear model to a dataset. For multiple response models (where you have more than one dependent variable), lm() can still be used, but you must adjust your approach when interpreting the p-values.
In a multiple linear regression, the model takes the form:
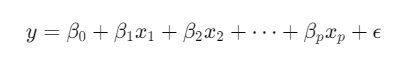
Here, yy is the dependent variable, and x1,x2,…,xpx_1, x_2, \dots, x_p are the independent variables. Each coefficient (like β1,β2,…\beta_1, \beta_2, \dots) will have an associated p-value, which tells you whether that particular predictor variable is statistically significant.
Step-by-Step Process to Extract P-values from lm() in R
Step 1: Fit a Linear Model Using lm()
The first step is to fit your linear model using the lm() function. Here’s an example where we fit a model with multiple predictors (x1, x2, x3) and a single response variable (y):
# Example data
set.seed(123)
data <- data.frame(
  y = rnorm(100),
  x1 = rnorm(100),
  x2 = rnorm(100),
  x3 = rnorm(100)
)

# Fit a linear model
model <- lm(y ~ x1 + x2 + x3, data = data)

# View the summary of the model
summary(model)
In the output of summary(model), you will get p-values for each coefficient (including the intercept) under the Pr(>|t|) column. These p-values tell you whether the individual predictors (x1, x2, x3) are significantly associated with the response variable (y).
Step 2: Extracting All P-values
To extract all p-values from your model, you can access the summary(model) object and specifically extract the p-values. Here’s how you can do it:
# Extract the summary of the model
model_summary <- summary(model)

# Extract p-values from the summary
p_values <- model_summary$coefficients[, 4]

# Print all p-values
print(p_values)
The coefficients matrix in the model summary contains the estimates for each coefficient, along with standard errors, t-values, and p-values. The p-values are stored in the fourth column, and we extract that column using [, 4].
Step 3: Multiple Responses (Multivariate Linear Regression)
If you have multiple response variables (multivariate regression), you can still use lm() to fit the model, but you’ll need to adjust the way you handle the model’s output. Here’s an example of fitting a model with multiple responses:
# Example with multiple responses
data$y2 <- rnorm(100)  # Adding another response variable

# Fit a linear model with multiple responses
model_multi <- lm(cbind(y, y2) ~ x1 + x2 + x3, data = data)

# View the summary of the multivariate model
summary(model_multi)
In this case, the lm() function will fit the model with multiple response variables, and the coefficients and p-values for each response variable will be displayed in the output.
Step 4: Extract P-values for Multiple Responses
To extract p-values for each response variable in a multiple response model, you need to access the p-values for each set of coefficients for each response.
# Extract summary of multivariate model
multi_summary <- summary(model_multi)

# Extract p-values for each response
p_values_multi <- lapply(multi_summary$coefficients, function(x) x[, 4])

# Print p-values for each response
print(p_values_multi)
Here’s how it works:
multi_summary$coefficientscontains the coefficients for all response variables.lapply()is used to loop over the coefficients for each response and extract the p-values (the fourth column).
The output will be a list where each element corresponds to the p-values for each response variable.
Step 5: Interpreting the P-values
Once you have the p-values, the next step is to interpret them:
- P-value < 0.05: This generally indicates that the predictor variable has a statistically significant relationship with the response variable.
- P-value > 0.05: This suggests that the predictor may not be significantly related to the response variable, and you might consider removing it from the model.
Conclusion
Extracting p-values from a linear model (lm()) in R is a straightforward process, whether you’re working with a simple model or a multivariate one with multiple response variables. Here’s a quick recap of the steps:
- Fit the model using
lm(). - Extract p-values using
summary(model)and indexing the coefficients matrix. - For multiple responses, extract p-values for each response variable using
lapply().
P-values are essential for understanding the statistical significance of the predictors in your model. Once you’ve extracted the p-values, you can use them to assess which variables significantly influence your response and refine your model accordingly.
Let me know if you need further assistance or additional examples!